IVIS is a chart editor for interactive visualisation, based on jQuery and HighCharts. Chart types include dot/scatter, 2D scatter, line, bar/column, pie, and heat map. It’s powerful when analysing large data sets.
- Dot / Scatter plot: X as names and Y holding one or more values
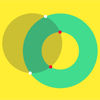
- 2D Scatter (XY Plot) using X-Y paird values, such as volcano plot, MA plot, 2D PCA, correlation chart, standard curve and so on
- Bar / Column chart: can use grouped data
- Line chart: multiple series can be plotted
- Pie chart: in 2D or 3D
- Heatmap fast overview of many data points