Best jQuery SVG Tutorial Plugins & Tutorials with Demo

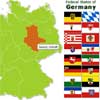
    Kartograph : jQuery Interactive map applications without Google Maps

    Kartograph : jQuery Interactive map applications without Google Maps

    Kartograph is a new framework for building interactive map applications without Google Maps or any other mapping service. It was created with the needs of designers and data journalists in mind.

    The core concept of Kartograph is to separate the mapping process in the map generation and map rendering part. The client-side library kartograph.js renders pre-generated maps stored in SVG files. You can chose among hundreds of ready-to-use maps or simply generate your own using kartograph.py, the open source Python SVG map generator.

    Add automatic area highlighting to image Maps with javascript : Mapper.js

    Add automatic area highlighting to image Maps with javascript : Mapper.js

    mapper.js allows you to add automatic area highlighting to image maps on your webpages (inc. export to SVG).

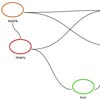
    Dracula : JavaScript Graph Library

    Dracula : JavaScript Graph Library

    Dracula is a set of tools to display and layout interactive graphs, along with various related algorithms.No Flash, no Java, no plug-ins. Just plain JavaScript and SVG. The code is released under the MIT license, so commercial use is not a problem.

    jVectorMap a jQuery vector map plugin

    jVectorMap a jQuery vector map plugin

    jVectorMap is a jQuery plugin utilized to illustrate vector maps and envisage data on HTML pages. It applies SVG in all contemporary browsers like Firefox 3 or 4, Safari, Chrome, Opera, IE9, at the same time supplying legacy support for older versions of IE from 6 to 8 with VML.

    CoolClock in jQuery

    jQuery analog clock

    CoolClock is a customisable javascript analog clock.Though this plugin uses SVG to draw analog clocks but uses Jquery to draw them. Comes with a lot of skins to choose from. Also supports digital clock.

    NETEYE Activity Indicator in jQuery

    NETEYE Activity Indicator in jQuery

    A jQuery plugin that renders a translucent activity indicator (spinner) using SVG or VML.

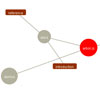
    arbor.js – A Graph Visualization Library

    jquery Graph Visualization Library

    Arbor is a graph visualization library built with web workers and jQuery. Rather than trying to be an all-encompassing framework, arbor provides an efficient, force-directed layout algorithm plus abstractions for graph organization and screen refresh handling. It leaves the actual screen-drawing to you. This means you can use it with canvas, SVG, or even positioned HTML elements; whatever display approach is appropriate for your project and your performance needs.