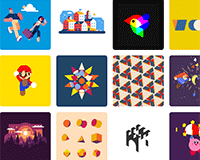
A little menu effect with composed of two things which is an SVG path overlay animation when it opens (or closes) and an infinite CSS powered background animation of an image grid.
Best jQuery SVG Tutorial Plugins & Tutorials with Demo
Zdog : A Pseudo-3D Engine for Canvas and SVG
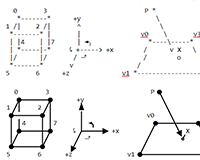
Zdog is a 3D JavaScript engine for <canvas> and SVG. With Zdog, you can design and render simple 3D models on the Web. Zdog is a pseudo-3D engine. Its geometries exist in 3D space, but are rendered as flat shapes.
Zdog uses the same principle. It renders all shapes using the 2D drawing APIs in either <canvas> or <svg>. Spheres are actually dots. Toruses are actually circles. Capsules are actually thick lines. It’s a simple, but effective trick. The underlying 3D math comes from Rotating 3D Shapes by Peter Collingridge.
Image Distortion Effects with SVG Filters
Today we would like to share three animated distortion effects by SVG filters that we apply to an image when hovering a text link. We use feTurbulence and feDisplacementMap to create different kinds of fragment and wave-like distortions. These kind of effects have become quite popular and there are many variations.
Lengthy : MicroLibrary for SVG Shape Length in a CSS Var
Lengthy is a JavaScript microlibrary (1.2kb min, 0.7kb gzipped) to get the length of SVG shapes. The length will automatically be added to the element as a CSS Var to make it easy to do CSS animations of SVG stroke-dashoffset for the wonderful line drawing SVG technique and other interesting animations.
JointJS – JavaScript Diagramming Library
JointJS is a JavaScript diagramming library. It can be used to create either static diagrams or, and more importantly, fully interactive diagramming tools and application builders.Rappid is a diagramming framework for advanced applications, delivering the best of HTML 5 + SVG and providing you with the right tools to build outstanding products.
Features:
- basic diagram elements (rect, circle, ellipse, text, image, path)
- ready-to-use diagram elements of well-known diagrams (ERD, Org chart, FSA, UML, PN, DEVS, …)
- custom diagram elements based on SVG or programmatically rendered
- interactive elements and links
- connecting diagram elements with links
- customizable links, their arrowheads and labels
- links smoothing (bezier interpolation)
- magnets (link connection points) can be placed basically anywhere
- hierarchical diagrams
- serialization/deserialization to/from JSON format
- highly event driven – you can react on any event that happens inside the paper
- zoom in/out
- touch support


