
Epoch is a general purpose charting library for application developers and visualization designers. It focuses on two different aspects of visualization programming: basic charts for creating historical reports, and real-time charts for displaying frequently updating timeseries data.
Best jQuery Chart & Graph Plugins & Tutorials with Demo

jQuery Dynamic Stock Charts
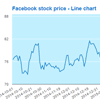
Dynamic Stock Charts is a jQuery plugin, which allows embedding highly customizable dynamic stock charts of almost any publicly traded company into your website by using simple HTML snippets automatically generated by the included charts builder.
- Automatically built and refreshed on each page load
- Area charts, Line charts and Candlestick charts supported
- Customizable titles, colors and backgrounds
- Zoom and history navigation controls
- Any time periods
- Unlimited number of different charts on one page
- Comprehensive stock chart builder included
- Built with Google Charts API
- Historical stock market data feed from Yahoo Finance
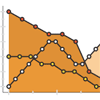
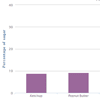


Grafikon : jQuery Chart Plugin
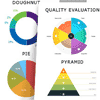
Grafikon is a JQuery Chart Plugin, that gives you the possibility to create your own unique chart with full customization. At present, there are six main modes: evaluation, pyramid, line, pie, doughnut and progress. Grafikon is easy to use and it is fully customizable – colors, sections, levels, fonts settings and many more. Also, Grafikon has a responsive option.

Google Charts with jQuery Ajax
If you are working for analytics project, you need a rich chart system to display big data results. Google is providing us a powerful chart tools that you can implement charts very simple, this tutorial will explain you how to implement Google charts with Jquery ajax JSON data. Try out there are many free interactive charts and data tools, take a quick look at this live demo.


