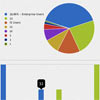
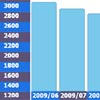
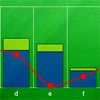
gRaphael is an Open Source Javascript Charting Library based on Raphael Javascript Library. It helps you to create stunning static and interactive charts with ease.gRaphaël is cross browser compatible and currently supports Firefox 3.0+, Safari 3.0+, Opera 9.5+ & Internet Explorer 6.0+.
Best jQuery Chart & Graph Plugins & Tutorials with Demo
jQuery with Google Charts : gvChart plugin
gvChart is a jQuery plugin, that uses Google Charts API to create interactive visualization by using data from the HTML table tag.
Its very easy to create charts with gvChart jQuery plugin:
1. Create an HTML table
2. Download and initialize gvChart
3. Connect gvChart to your table
Easily customizable and allows to create Area, Line, Bar, Column and Pie charts.
JSON Driven Zoomable Drill Down Bar Chart: DDChart
DDChart is a JSON data driven bar chart plugin that creates a classy bar chart with flash like animation effects.
Its a small yet useful bar chart jQuery plugin that is packed with nice features including:
- Zoom-in / zoom-out effect on bar charts during drilling up / down with flashy animations
- Bars, legends, and fonts expand and contract to fit their container
- On load chart recalculations to fit all containers
- Automatic drill up breadcumb creation
jQuery OrgChart – a plugin for visualising data in a tree-like structure
jQuery OrgChart is a jQuery plugin that allows you to render structures with nested elements in a easy-to-read tree structure. To build the tree all you need is to make a single line call to the plugin and supply the HTML element Id for a nested unordered list element that is representative of the data you’d like to display.Showing/hiding a particular branch of the tree by clicking on the respective node.Drag-and-drop reorganisation of elements.Nodes can contain any amount of HTML except <li> and <ul>.Very easy to use given a nested unordered list element.
jQuery Sparklines Graph
This jQuery plugin generates sparklines (small inline charts) directly in the browser using data supplied either inline in the HTML, or via javascript.
The plugin is compatible with most modern browsers and has been tested with Firefox 2+, Safari 3+, Opera 9, Google Chrome and Internet Explorer 6, 7 & 8.
Elycharts an ultimate jQuery charting library
Elycharts is a pure JavaScript charting library, easy to use and completely customizable. It helps you create good looking interactive charts on you web pages or web applications, with a lot of useful features: legend and label support, mouse tracking, tooltips, templates, animations, and more.
Create An Animated Bar Graph With HTML, CSS And jQuery
Graphs of financial projections, quarterly sales figures and market saturation are a middle-manager’s dream.How can we as Web designers get in on all of this hot graph action? There are actually quite a few ways to display graphs on the Web. We could simply create an image and nail it to a Web page. But that’s not very accessible or interesting. We could use Flash, which is quite good for displaying graphs — but again, not very accessible. Besides, designers, developers and deities are falling out of love with Flash. Technologies such as HTML5 can do many of the same things without the need for a plug-in. The new HTML5 <canvas> element could even be adapted to the task. Plenty of charting tools are online that we might use.


