dygraphs is an open source JavaScript library that produces produces interactive, zoomable charts of time series. It is designed to display dense data sets and enable users to explore and interpret them.
Features
- Plots time series without using an external server or Flash
- Works in Internet Explorer (using excanvas)
- Lightweight (45kb) and responsive
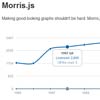
- Displays values on mouseover (this makes it easily discoverable)
- Supports error bands around data series
- Interactive zoom
- Adjustable averaging period
- Can intelligently chart fractions
- Customizable click-through actions
- Compatible with the Google Visualization API
- Intelligent defaults make it easy to use