Graphs of financial projections, quarterly sales figures and market saturation are a middle-manager’s dream.How can we as Web designers get in on all of this hot graph action? There are actually quite a few ways to display graphs on the Web. We could simply create an image and nail it to a Web page. But that’s not very accessible or interesting. We could use Flash, which is quite good for displaying graphs — but again, not very accessible. Besides, designers, developers and deities are falling out of love with Flash. Technologies such as HTML5 can do many of the same things without the need for a plug-in. The new HTML5 <canvas> element could even be adapted to the task. Plenty of charting tools are online that we might use.
Best jQuery HTML5 canvas Plugins & Tutorials with Demo
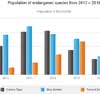
Create An Animated Bar Graph With HTML, CSS And jQuery
Tipped a beautiful jQuery HTML5 tooltips plugin
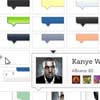
Tipped allows you to easily create beautiful tooltips using the jQuery Javascript library. Tipped takes tooltips to the next level by using HTML5 to give you full control over the look and feel of your tooltips.
The entire skin of the tooltip, from shadow to loading icon, is drawn using Canvas. This means you can easily change the style of your tooltips without having to create any images.
MotionCAPTCHA – jQuery Captcha plugin
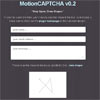
MotionCAPTCHA is a jQuery CAPTCHA plugin, based on the HTML5 Canvas Harmony procedural drawing tool by Mr Doob and the $1 Unistroke Gesture Regonizer algorithm (and the more recent Protractor algorithm improvement), requiring users to sketch the shape they see in the canvas in order to submit a form.
TagCanvas – jQuery Animated Tag Cloud
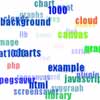
An HTML5 canvas-based plugin which replaces <a href="..."> links with a 3D rotating cloud of tags.
Tested in FireFox, Chrome, Opera, Safari. Also tested in IE8, where it obviously doesn’t work except in conjunction with ExplorerCanvas. Now works in the IE9 beta/release candidate without ExplorerCanvas.
arbor.js – A Graph Visualization Library
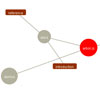
Arbor is a graph visualization library built with web workers and jQuery. Rather than trying to be an all-encompassing framework, arbor provides an efficient, force-directed layout algorithm plus abstractions for graph organization and screen refresh handling. It leaves the actual screen-drawing to you. This means you can use it with canvas, SVG, or even positioned HTML elements; whatever display approach is appropriate for your project and your performance needs.

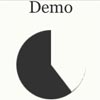
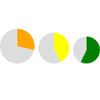
A Snazzy Animated Pie Chart with HTML5 and jQuery
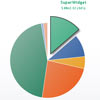
In this tutorial I’m going to show you how to build a lovely, interactive pie chart using the latest HTML5 technologies. Not that long ago, this kind of thing was only practical to do with Flash. Now, thanks to advances such as the HTML5 canvas element, we can create pretty nifty animated effects using nothing but JavaScript, CSS, and a small sprinkling of maths!
BeautyTips a jQuery tooltips plugin

BeautyTips is a jQuery tooltips plugin which uses the canvas drawing element in the HTML5 spec to dynamically draw tooltips associated with a html element on the page. The thing I like best about BeautyTips is it’s limmitless ways to configure the look and feel and event triggering behavior. For example, with BeautyTips it would be relatively easy to match the tooltips used on popular websites like Netflix, Google Maps, Hulu, or Facebook.